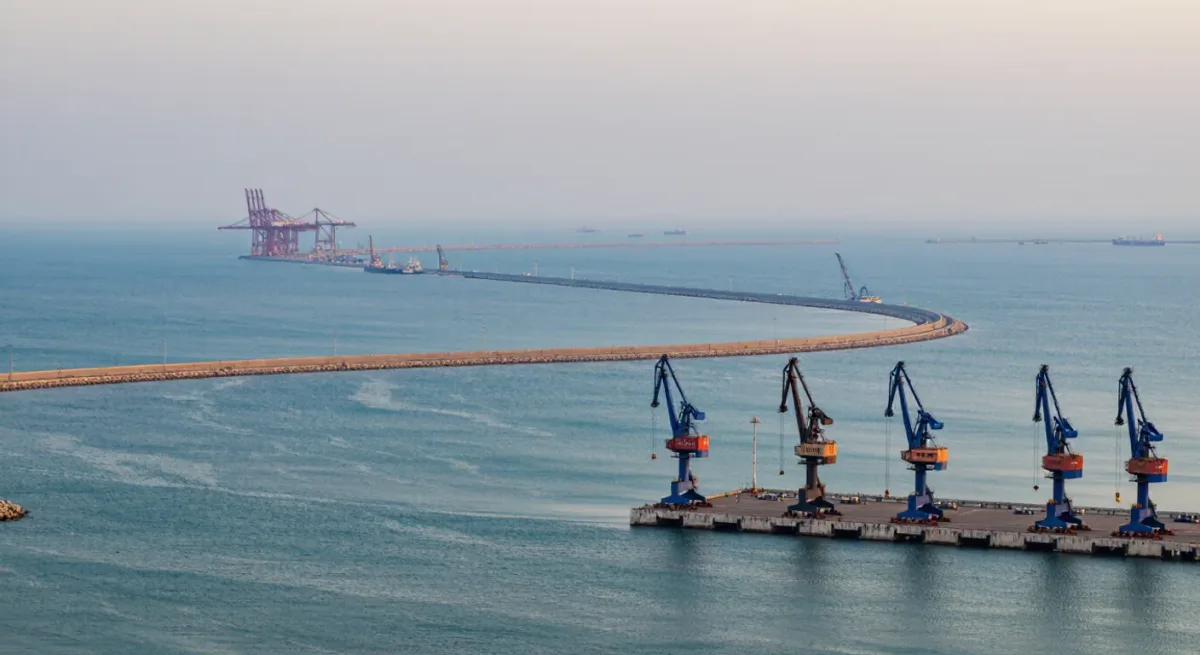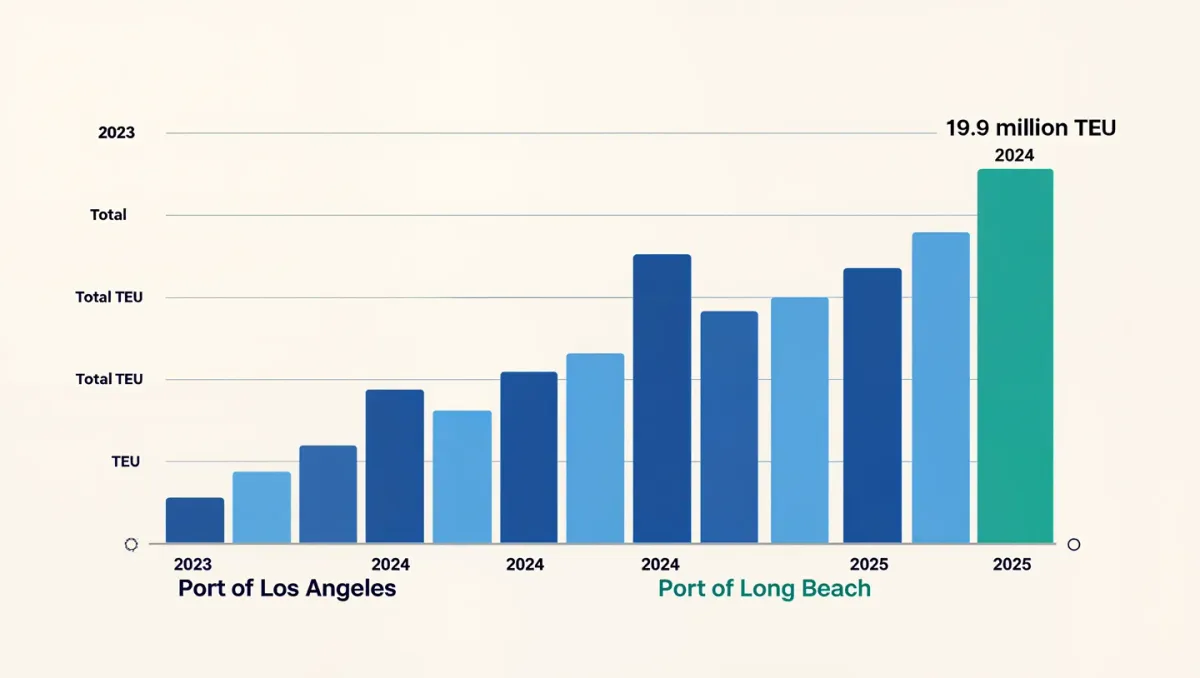
On any given night, dozens of gantry cranes stand over the harbors of San Pedro Bay, picking steel boxes off vessels that carry most of the consumer goods sold west of the Rockies. The neighboring ports of Los Angeles and Long Beach handled a combined 19.9 million twenty-foot equivalent units in 2024, per port statistics — their busiest year on record — and together they process roughly a third of all containerized imports entering the United States.
That share is why a slowdown in ship arrivals at two Los Angeles-area terminals shows up within weeks on warehouse payrolls a hundred miles inland, and why port volumes have become California's most-watched monthly economic indicator.
What the ports actually measure
The headline number at each port is TEUs, or twenty-foot equivalent units. One standard container counts as one TEU; a forty-foot container counts as two. Volumes are reported as loaded and empty moves, and the loaded figure is what economists track, because empty boxes mostly reflect the logistics of repositioning equipment rather than trade.
Imports dominate the ledger. Loaded imports have long outnumbered loaded exports at both harbors, a structure that reflects the American consumer economy: goods arrive from Asia, move inland by rail and truck, and relatively little containerized cargo comes back the other way. When analysts cite a dip in volumes, they separate tariff effects, seasonal restocking, and the annual shift of factory production before Lunar New Year, which reliably depresses February numbers and swells August through October as retailers build holiday inventory.
How a container becomes a paycheck
A single container creates work at nearly every step. A marine clerk at the terminal coordinates the crane move. A drayage trucker hauls the box to a warehouse in the Inland Empire or a rail ramp in Vernon. Longshore crews, mechanics, customs brokers, freight forwarders and truck-leasing firms all bill against the same metal box.
The ports cite the standard multiplier that every 1,000 TEUs supports on the order of nine jobs in the regional economy — a figure the Los Angeles Economic Development Corporation has used in port impact studies. In total, the San Pedro Bay complex supports more than half a million jobs across Southern California, per the ports' own impact analyses, and hundreds of thousands more across the country through rail and distribution links.
The work is unionized at unusually high rates. Dock labor runs through the International Longshore and Warehouse Union under a master contract negotiated with the Pacific Maritime Association, and port trucking employs tens of thousands of drivers whose employment classification has been the subject of state legislation and litigation for a decade.
Why volumes swing so hard
Port counts respond faster than almost any other economic series. In early 2025, monthly figures at the twin ports fell sharply from their 2024 records as new tariff policy slowed import bookings, per the ports' monthly reports — a decline visible in the numbers weeks before it appeared in state employment data. The same speed works in reverse: when importers front-run expected tariff increases, volumes spike, congesting terminals and tightening drayage capacity.
Local factors compound the swings. Rail service out of the harbors, chassis availability, labor contract negotiations, and even airline-style vessel bunching after weather delays can move a month's count by hundreds of thousands of TEUs without changing underlying demand.
The history written into the layout
The region's dominance was not inevitable. Los Angeles overtook the Bay Area harbors in the 1990s on the strength of bigger berths, deeper channels and the 2002 opening of the Alameda Corridor — a 20-mile freight rail expressway linking the harbors to downtown rail yards that eliminated dozens of street-level grade crossings. The corridor's per-container fee still funds its bonds, and its capacity ceiling is one reason port planners talk constantly about on-dock rail, which loads containers directly onto trains at the terminal instead of trucking them across town first.
Longshore work changed with the cargo. Containerization, which reached maturity here in the 1960s and 1970s, replaced a port of break-bulk gangs with one of machine operators and clerks, and the workforce shrank even as tonnage multiplied. The registered longshore workforce and the casual hiring hall still rank among the best-paid blue-collar jobs in the state, which is why every master contract negotiation draws statewide attention.
The infrastructure race
Both ports are spending heavily to hold their position. The Port of Los Angeles has a capital program exceeding $2 billion across a multi-year horizon, weighted toward terminal upgrades, zero-emission equipment and the rail links that move containers out of the harbor without touching a freeway. Long Beach's program is of similar scale. Both face a state mandate to shift cargo handling to zero-emission technology in the coming decades, which means today's crane counts eventually share a balance sheet with electric truck fleets and shore power installations.
Competition is part of the calculus. Gulf and East Coast ports have gained share of Asian cargo as vessel routing and Panama Canal capacity evolve, and a widened Suez-reliant trade or new manufacturing footprints in Southeast Asia can reshape which U.S. harbors see the boxes first.
What to watch
Three numbers will tell the 2026 story: monthly loaded TEUs against the 2024 record pace, the spread between imports and exports, and Inland Empire warehouse employment in the quarterly state data. If container counts flatten while warehouse payrolls shrink, the slowdown will have moved past the docks into the broader Southern California logistics economy.