The number lands every month like a verdict: California's statewide median home price stood at $850,680 in December 2025, per the California Association of Realtors — roughly double the national figure and more than the median household in the state earns in a decade. But the median describes the middle of what sold last month, not the middle of what exists, and knowing the four ways it moves is the difference between reading the market and misreading it.
This site publishes information, not financial or real estate advice. Purchase decisions depend on individual finances, mortgage qualification and local conditions the statewide number cannot see.
Why the median moves in two directions at once
The median price is the midpoint of closed transactions. That means it rises when expensive homes sell and falls when cheap ones do, even if no individual house changes value. In 2025 the clearest driver was the rate lock-in effect: homeowners holding mortgages written at 3 percent in 2020-2021 refused to list, shrinking the supply of entry-level resales, so first-time-buyer inventory thinned and the sales mix tilted toward the move-up and luxury segments that were less rate-sensitive. Per C.A.R. monthly reports through 2025, sales volume ran well below historical norms even as the median hovered near record levels — a combination that signals constrained mix, not runaway appreciation.
The seasonal pattern compounds it. Medians peak in spring and summer, when family buyers close escrow, and sag in December and January — the December figure of $850,680 sat well above January 2025's $839,130 partly because of where the sales mix landed, not because December is a strong month. Comparing any month to the same month a year earlier is the only comparison that means anything.
What the statewide number hides
Condo and townhouse sales pull the figure down while new-construction medians push it up, and distressed sales are rare enough now that their absence flatters the number: in the foreclosure-heavy years after 2008, the statewide median fell by a third even though most houses kept most of their value. California is nine markets wearing one statistic. Per C.A.R. county data through 2025, the median in San Francisco, San Mateo and Santa Clara counties exceeded $1.5 million; in parts of the Central Valley — Merced, Bakersfield — it stayed below $450,000. The same statewide median implies different affordability in each: C.A.R.'s housing affordability index has run near 15 percent statewide, meaning roughly one in six households can afford the median-priced home at prevailing rates, while the Inland Empire and Central Valley post affordability near double that and the Bay Area near single digits.
Regional timing diverges too: coastal metros led the 2021-2022 run-up, while inland markets carried more of the post-2023 appreciation as remote workers traded commute distance for square footage. Insurance has joined price and mortgage rate as a market variable. In wildfire-prone counties, premium increases and non-renewals now feed into offers and appraisals, a shift visible in seller disclosures and buyer negotiations since the 2025 Palisades and Eaton fires concentrated attention on insurability.
How the competing indexes differ
Readers see different medians because firms count different things. C.A.R. reports closed transactions of existing single-family homes by county, weighted toward Realtor-involved sales. Zillow's home value index estimates value for the entire housing stock — including homes that never list — which is why its statewide figure has run tens of thousands of dollars below C.A.R.'s. Case-Shiller tracks repeat sales of the same homes, the cleanest appreciation measure but one published with a two-month lag. Mortgage rate movements close the loop: per Freddie Mac surveys, the 30-year fixed spent 2025 between roughly 6 and 7 percent, the band that has defined affordability since 2023.
The supply story underneath every median
California's price level begins with a shortage measured in units. State analyses, including the Department of Housing and Community Development's statewide housing assessment, put the cumulative underproduction since the 1990s at roughly a million homes short of demand in recent estimates, with permitting averaging well below the 180,000-plus units a year that most projections say the state needs. The result shows up in behavior: California's homeownership rate has run near 55 percent against about 65 percent nationally, per census data, and the state's population of renters who are cost-burdened — paying more than 30 percent of income for housing — remains above 50 percent of renter households.
New supply categories are beginning to register in the data. Accessory dwelling units, now permitted by right statewide, made up an increasing share of housing permits in Los Angeles and San Diego in recent years, and builder's-remedy and transit-oriented projects have added approvals in wealthy cities that long permitted little. Neither shifts the statewide median quickly; both show up first in permit counts, the leading indicator worth watching before the price reports arrive.
What this changes for a California reader
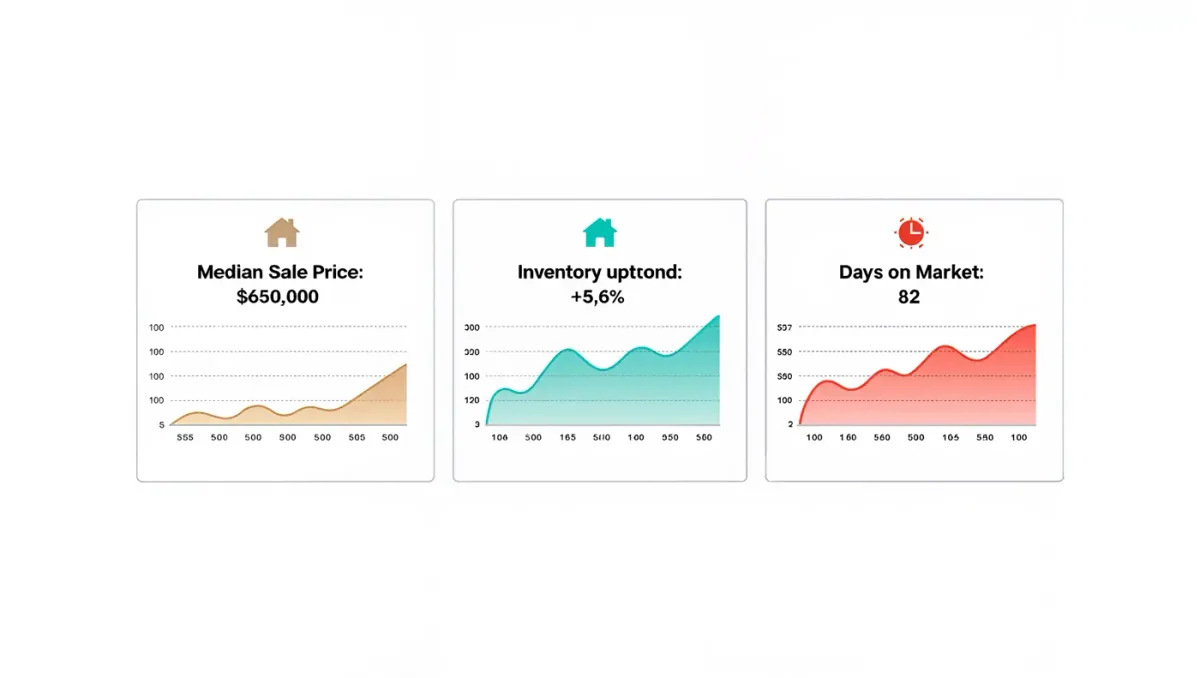
For a household tracking the market from the sidelines, the useful signals are not the headline median. They are active listings per county, the share of price cuts, days on market, and the median sold-to-list ratio — each published monthly and each less distorted by mix. A falling statewide median alongside thin sales means the mix shifted, not that prices collapsed.
For the year ahead, watch three things: whether mortgage rates settle in the high-5s, as some forecasts for 2026 suggested; whether lock-in loosens enough to rebuild entry-level inventory; and the affordability index, which summarizes the entire mechanism in one number. The median will keep making headlines. The affordability index tells you who the headline describes.